Respuesta cortaShort answer
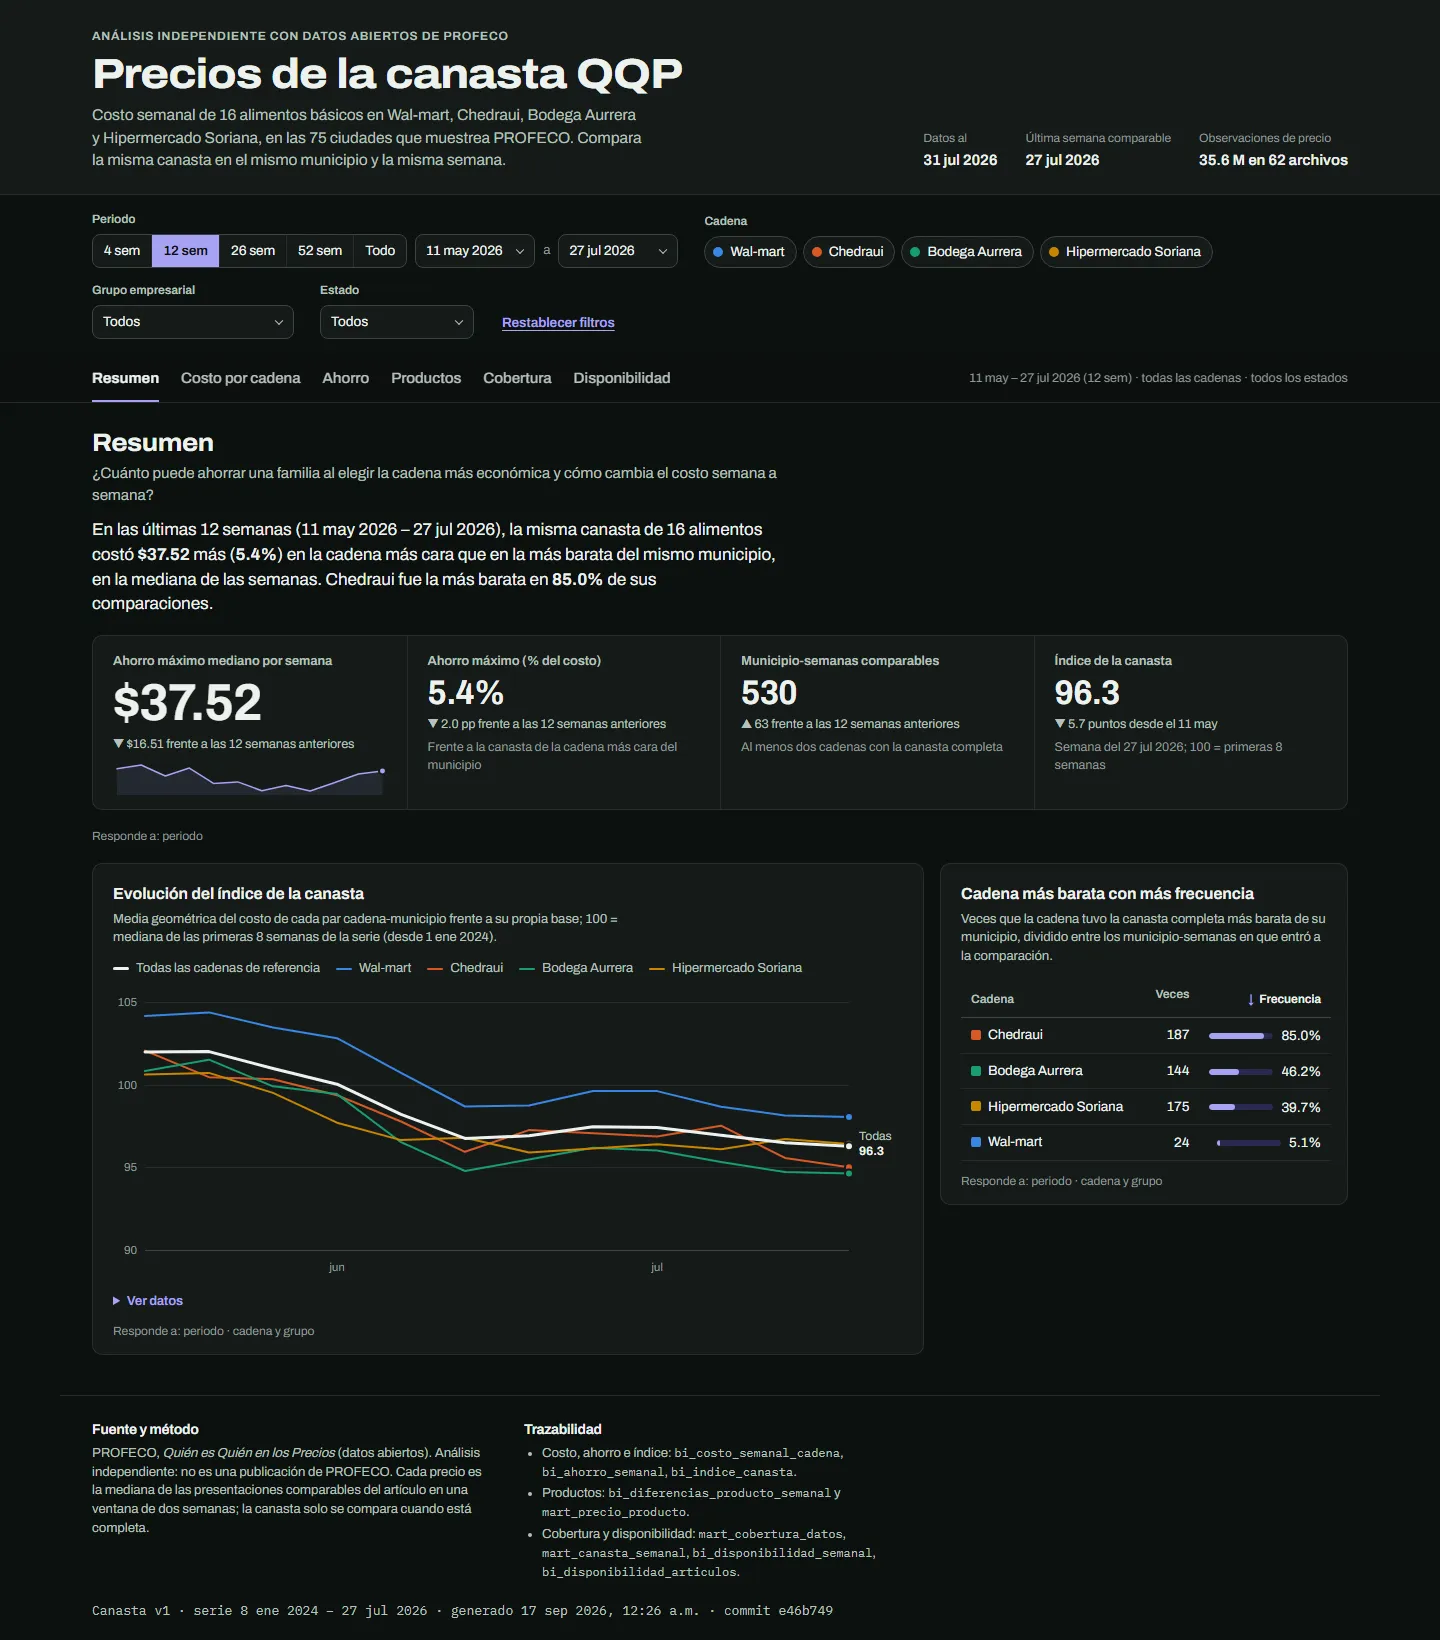
Elegir bien la tienda vale entre 48 y 64 pesos por canasta y semana, según cuántas cadenas compitan en el municipio: 6.7 % del costo con dos cadenas y 8.8 % donde están las cuatro. Cinco productos frescos explican el 73 % de esa diferencia.
Picking the right store is worth 48 to 64 pesos per basket per week, depending on how many chains compete in the city: 6.7% of the cost with two chains and 8.8% where all four are present. Five fresh items explain 73% of that gap.
| EscenarioScenario | Municipio-semanasCity-weeks | Ahorro medianoMedian saving | p90 |
|---|---|---|---|
| Todas las celdas comparablesAll comparable cells | 5,630 | $48.08 (6.7 %) | $92.60 |
| Municipios con las 4 cadenasCities with all 4 chains | 801 | $64.03 (8.8 %) | $105.22 |
| Solo entre grupos distintosOnly across different groups | 5,352 | $49.52 (6.9 %) | $93.35 |
Lo que encontréWhat I found
- Chedraui es la más barata en 7 de cada 10 municipio-semanas donde está presente. Wal-mart es la más cara del grupo comparado: cambiarse desde ahí equivale a unos 1,665 pesos al año.
- Importa más dónde se compra dentro de la ciudad que en qué ciudad. Entre municipios las diferencias son chicas: el más barato y el más caro se separan menos de 6 puntos del nivel nacional (Boca del Río 97.1, La Paz 102.7).
- Por peso en el bolsillo manda la carne; por diferencia relativa, los frescos. La milanesa aporta la quinta parte de la diferencia con un sobreprecio de apenas 7.5 %, porque es el artículo más caro. Limón, jitomate y cebolla llegan a costar entre 34 % y 41 % más según la tienda, en la misma ciudad y la misma semana.
- La canasta bajó al cierre del periodo. El índice de panel fijo se movió entre 95.6 y 104.0 durante dos años y medio. Tras el pico de abril de 2026 bajó a 96.8 en julio, alrededor de 7 % menos, en plena temporada de frescos.
- Un sobreprecio que no es precio. La pasta para sopa tiene el sobreprecio mediano más alto (106.5 %), pero ahí se compara marca propia contra marca comercial, así que no lo trato como diferencia de precio.
- Chedraui is the cheapest in 7 out of 10 city-weeks where it is present. Wal-mart is the most expensive of the group: switching away from it is worth about 1,665 pesos a year.
- Where you shop within a city matters more than which city. Differences between cities are small: the cheapest and the most expensive sit less than 6 points from the national level (Boca del Río 97.1, La Paz 102.7).
- In pesos, meat dominates; in relative terms, fresh produce does. Beef cutlet makes up a fifth of the gap with a markup of only 7.5%, because it is the priciest item. Lime, tomato and onion cost 34% to 41% more depending on the store, in the same city and the same week.
- The basket got cheaper at the end of the period. The fixed-panel index stayed between 95.6 and 104.0 for two and a half years. After the April 2026 peak it fell to 96.8 in July, about 7% lower, in the middle of the fresh-produce season.
- A markup that isn't a price. Soup pasta has the highest median markup (106.5%), but it compares store brand against name brand, so I don't treat it as a price gap.
Cómo lo construíHow I built it
- IngestaArchivos abiertos de PROFECO a DuckDB, con contrato de datos.
- IngestionPROFECO open files into DuckDB, with a data contract.
- NormalizaciónProductos y presentaciones comparables entre tiendas.
- NormalizationProducts and package sizes made comparable across stores.
- ModeloEsquema estrella en dbt con pruebas en cada capa.
- ModelStar schema in dbt with tests at every layer.
- ValidaciónRecálculo independiente desde el dato crudo: 24 de 24 coinciden.
- ValidationIndependent recomputation from raw data: 24 out of 24 match.
- PublicaciónCuatro marts y un dashboard que GitHub Actions regenera en cada ejecución.
- PublishingFour marts and a dashboard that GitHub Actions rebuilds on every run.
Cuando la fuente falló, el pipeline hizo lo correcto. En octubre de 2026 PROFECO reorganizó su catálogo de datos abiertos: los enlaces anteriores devuelven 404 y los archivos de la ruta nueva llegan truncados a media lectura. El pipeline, que revisa el origen el día 1 de cada mes, se detiene en el primer paso y no publica nada a medias. Cuando el origen vuelva a publicar archivos completos, la siguiente ejecución los incorpora sola.
When the source broke, the pipeline did the right thing. In October 2026 PROFECO reorganized its open data catalog: the old links return 404 and files on the new path are truncated mid-read. The pipeline, which checks the source on the 1st of every month, stops at the first step and publishes nothing half-done. Once the source serves complete files again, the next run picks them up on its own.
Lo que no se puede afirmarWhat this can't claim
- La canasta es genérica: cada artículo es la mediana de cualquier marca comparable, así que parte de la diferencia refleja la mezcla de marcas de cada cadena.
- Las cantidades son la presentación más frecuente, no el consumo de un hogar. El costo es un índice comparable, no el gasto real de una familia.
- En la mediana de las celdas, cada cadena está representada por una tienda y un día de levantamiento por semana.
- 24 de los 75 municipios nunca tienen dos cadenas completas la misma semana, así que el ahorro se estima sobre 51.
- Los datos más recientes tienen 47 días de rezago respecto a la publicación de PROFECO.
- The basket is generic: each item is the median of any comparable brand, so part of the gap reflects each chain's brand mix.
- Quantities are the most common package size, not a household's consumption. The cost is a comparable index, not what a family actually spends.
- In the median cell, each chain is represented by one store and one collection day per week.
- 24 of the 75 cities never have two complete chains in the same week, so savings are estimated over 51.
- The latest data lags PROFECO's publication by 47 days.